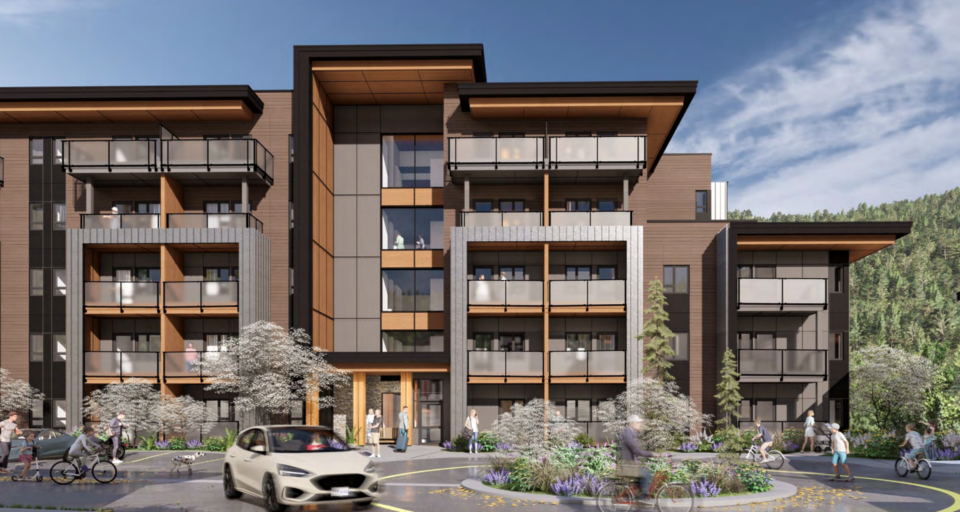
A recent staff report from the Resort Municipality of Whistler (RMOW) has prompted clarification from the Whistler Development Corporation (WDC) regarding construction cost comparisons for Cheakamus Crossing Lot 3.
While RMOW staff reported a 40-per-cent cost increase between Lot 2B and the proposed Lot 3 project in the June 10 council agenda, former WDC president Eric Martin says that figure doesn’t accurately reflect project realities.
“When you do a straight comparison, sure, the costs appear 40-per-cent higher, but that’s not an apples-to-apples comparison,” Martin said in an interview with Pique. “What was quoted as 40 per cent is actually closer to seven to 10 per cent, which is quite amazing to me, given what we’re seeing in construction cost escalation.”
Martin said he flagged the issue with senior staff and the mayor ahead of the meeting, but acknowledged the busy council schedule and the complexity of the project may have led to the item going uncorrected during public discussion.
In its staff report, the RMOW stated Lot 3’s estimated cost per square foot is $719.82—approximately 40-per-cent higher than Lot 2B, completed in 2022 at $514.72 per square foot. But Martin argues the comparison overlooks several important factors, including increased building code requirements, and the economies of scale that come with larger projects.
“[These lots have] a completely different set of criteria,” he said. “Smaller jobs don’t benefit from the same economies of scale. And over time, we’ve had different building code requirements—things like mechanical ventilation, higher-rated windows, better insulation. Those costs increase our scope but aren’t directly comparable.”
He also pointed to broader industry conditions. “In the last three years, we’ve seen more than a 60-per-cent increase in hard construction costs in B.C.,” he said. “That’s one of the reasons these projects are harder and harder to pull off—along with interest rates.”
The WDC typically tracks project budgets across 19 or 20 line items, Martin explained, which provides a clearer view of changing cost drivers over time. “We maintain costs for every project to know what we’ve done in the past and what trends look like. But we don’t just lump everything into one figure.”
The RMOW, for its part, stood by the figure presented in its June 10 report.
“Transparency is very important for local government as we are always conscious of the trust we must earn from our constituents in all our financial dealings,” the municipality said in a statement to Pique. “We hold ourselves to an extremely high standard of fiscal accountability and, ultimately, we chose to calculate this project cost more holistically.”
Municipal staff explained the figure includes contingency costs—something they say is necessary in today’s volatile market, particularly due to uncertainties like U.S. trade tariffs.
“It is a large project at 125 proposed units, and construction costs have continued to increase over time,” the statement said. “It was flagged ahead of the meeting, however, as mentioned, staff’s report included a project budget amount inclusive of contingency costs. This is the conservative estimate and did not need to be amended, as there was no error.”
Still, Martin emphasized clearer communication could have helped the public better understand the context.
“When we did our original project plan, we could have explained it better,” he said. “But it’s important to understand that these cost increases are happening over time, and they’re tied to very real changes in building regulations and market conditions.”


