
In 1991, Guns N’ Roses released the classic rock ballad “November Rain,” which was confusing for some of us in Saskatchewan.
Hearing it as a child growing up on the vast, frozen tundra we call the prairies, I assumed Axl Rose was going for some kind of clever metaphor—being absolutely certain, as I was, that rain in November was simply not possible.
Of course, as everyone living on the West Coast can attest, rain in November is not only possible, it’s often inevitable.
The past couple weeks in Whistler are proof.
And as opening day creeps ever closer, all eyes are on the snowline drifting its way towards the valley floor.
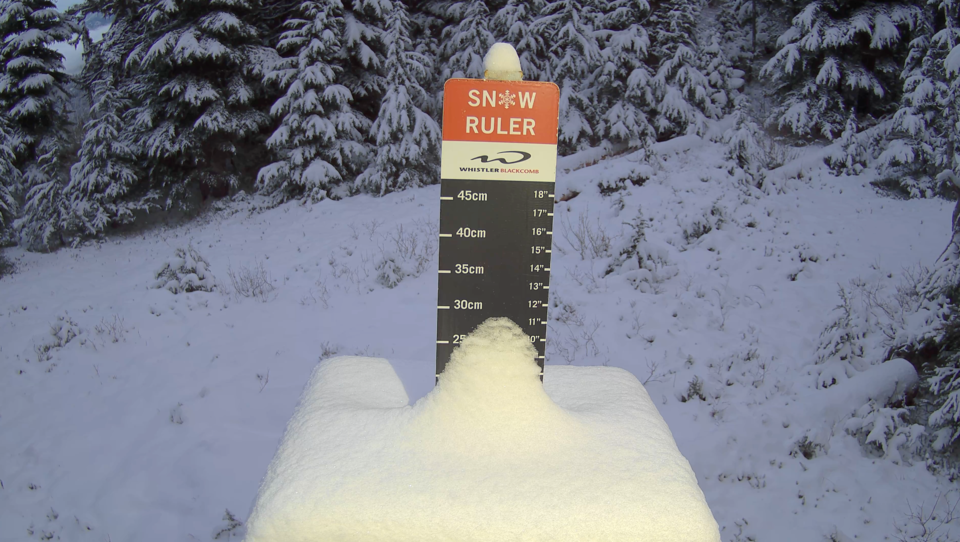
The snow is slow to arrive in the valley so far this year, but not to fear—as always, Whistler Blackcomb’s (WB) 359 snow guns are hard at work faking winter in the mountains.
“We’re certainly hopeful for the forecast through the back half of next week after the storm moves through on the weekend, and cautiously optimistic about what that will bring in terms of natural snow,” WB’s new chief operating officer and VP Belinda Trembath told Pique on Nov. 9. “We’re certainly ready to go, so no concerns about our snowmaking capacity, and certainly the team are ready to go. They’re all trained up and we’re in production.”
But how does this November’s meagre snowfall stack up against other years?
According to Environment Canada’s weather station on Nesters Road, November is often a month of extremes when it comes to snowfall. (In an email after Pique's weekly deadline, an Environment Canada spokesperson noted data from March 2007 onward has not been quality controlled, and could contain errors. "The climate station in Whistler with the most recent and reliable snowfall data is Whistler Roundhouse," they said.)
From 1980 to 2019, Whistler saw, on average, 61 centimetres of snow in November. But that of course doesn’t tell the full story.
Broken down by decade, November snowfall in Whistler is showing signs of decline. From 1980 to ’89, the resort averaged 64.7 cm in November. From 1990 to 99, it averaged 75.95, and from 2000 to 2009, that dropped to 57.51.
From 2010 to 2019, November’s average was 45.61 centimetres of snow in the Whistler Valley.
On only two occasions since 1977 has Whistler gone a full November with no snow: in 2002 and 2019. The biggest snowfall accumulation on record for the month came in November 1984, when a staggering 195.4 cm fell in the valley—a monthly total that is among the biggest ever seen in Whistler (the overall honour goes to December 1996, when 257.6 cm were recorded in the valley—more than the total annual accumulation of 1981, 2005, 2013, 2015, and 2022).
It’s no surprise the record occurred in December, which, since 1980, has proven Whistler’s money month when it comes to snow, with an average monthly snowfall of about 108 cm from 1980 to 2019.
By decade: Dec. 1980 to 1989 (88.31 cm); 1990 to 99 (136 cm); 2000 to 2009 (115.73 cm); and 2010 to 2019 (91.44 cm).
So, aside from the ’80s, which appears to be something of an outlier decade in terms of snowfall, December’s totals are also trending downwards.
And Whistler’s total annual snowfall accumulation is also declining, at least in the valley.
From 1980 to ’89 (again, something of an odd decade for snowfall), Whistler saw a total of 3,713.8 cm, for an average of about 371.38 per year.
From 1990 to ’99, local skiers and boarders were spoiled, as the resort tallied 4,783 cm in the valley (an average of about 478 cm per year).
According to Environment Canada, 1999 is the biggest calendar year on record in terms of snowfall, with an astounding 716.1 cm recorded in the Whistler Valley from January to December.
To put that into context, 1999 is the only calendar year the resort topped the 700-cm mark, and it has only surpassed 600 cm three times: in 2006 (657.7 cm); 1990 (646.9 cm); and 1994 (632 cm).
From 2000 to 2009, Whistler recorded 4,056 cm of total snowfall, for an average of about 406 cm per year. From 2010 to 2019, that number dropped to 3,336 cm and an average of 333.6 cm per year.
So it would appear Whistler is seeing less snow than it did in decades past.
In fact, from 2010 to 2019, the resort did not top the 500-cm mark once, according to Environment Canada’s data, and the lowest snow year on record occurred in 2015, when just 142.1 cm were tallied in the valley.
That’s only slightly above the 165.6 cm counted in 2022—good enough for the second lowest year on record.
And to top it all off, it’s looking very likely 2023 will go down as the absolute worst snow year on record; as of this writing, a measly 47.4 cm have fallen in Whistler this calendar year, meaning December has its work cut out for it if 2023 wants to avoid the honour of worst snow year ever.
What else can we glean from this comprehensive and time-consuming data collection and sorting project?
Well, we’re not quite halfway through our current decade, so it’s possible we see a snowfall resurgence—but current trends are not encouraging. From 2010 to 2019, Whistler had only one month, December 2016, that tallied more than 150 cm of snow.
Compare that to 2000 to 2009, which counted six months with more than 150 cm, or 1990 to 1999, which had eight, and it’s easy to see which way we’re headed.
So… what bounties will Ullr bestow upon us in 2024? Only time will tell. Fire up your ski burns and hope for the best.
But the long-term trends point to a snowline that, eventually, never quite reaches valley bottom—and plenty more of that cold November rain.


